Longitudinal View
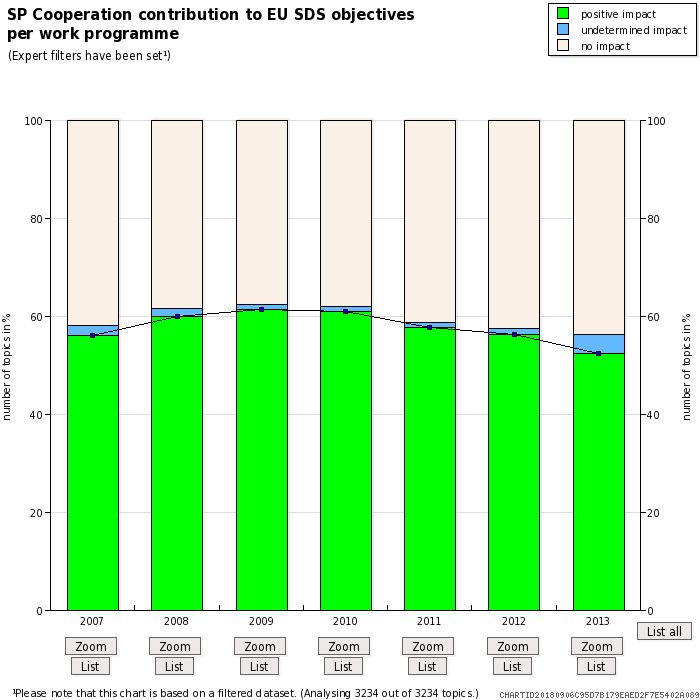
The Longitudinal View allows for analysing the FP7 contribution to sustainable development over time by producing bar charts and tables corresponding to the annual FP7 Work Programmes that have been published since 2007. This view analyses the whole database thus please allow a few seconds for it to load. Please note that the graph presents the data in percent, whereas the table shows the corresponding absolute figures. Clicking on the bars in the graph or on the “Zoom” buttons below the graph will take you to the FP7 View, where the corresponding filter settings will be applied (i.e. when you click on the bar related to Work Programme 2007, the respective filter for WP 2007 will be activated in the FP7 View). Clicking on the “list” buttons below the graph or on the figures in the table will take you to a list of FP7 themes, activities, areas, topics and projects from the respective Work Programme. Additionally, you can apply one or several expert filters to focus the analysis on specific areas of interest. For a video tutorial explaining the functionality and features of this View, please click on the screenshot on the right or visit the “Video tutorials” section.


