FP7 View
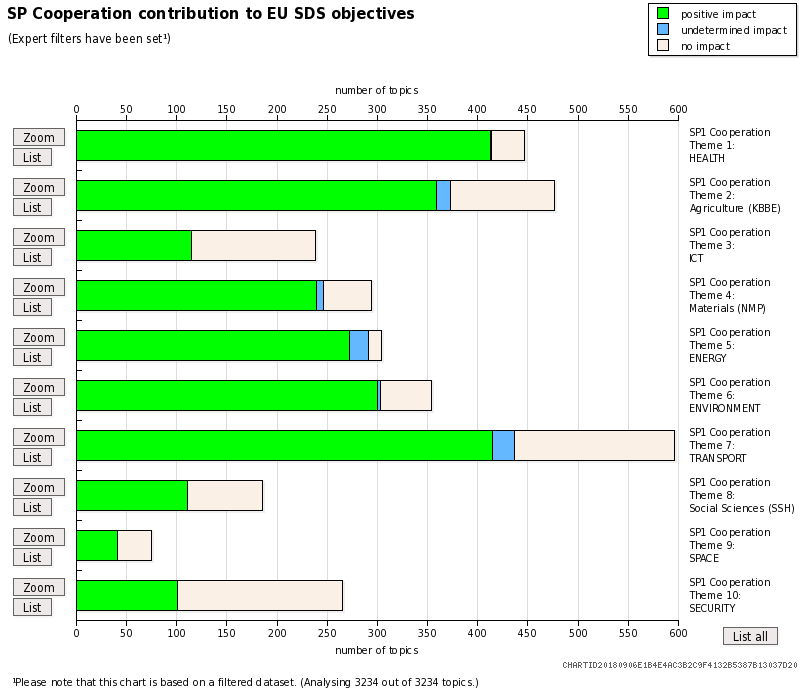
The FP7 View allows to interactively analyse the data of the monitoring system according to the structure of the 7th EU Framework Programme by producing tables and bar charts. This view analysis the whole database thus please allow a few seconds for the chart to load. On this level you can zoom into a specific FP7 Theme, Activity or Area, display the list of Topics and respective projects (by clicking one of the ‘list’ buttons or by clicking on the number of Topics in the table), send the chart and table as a PDF-file to your own email-address or apply one or several expert filters to focus the analysis on specific areas of interest. For a video tutorial explaining the functionality and features of this View, please click on the screenshot on the right or visit the “Video tutorials” section.